




News & Insights | October 10, 2026
What a Quarterly Review Looks Like When It Is Built From Live Data
A review deck assembled by hand the night before is a story. One built from live data is evidence. Here is what ours contains, section by section.
By Reid McConkey

A review deck assembled by hand the night before is a story. One built from live data is evidence. The difference shows in the first 5 minutes of the meeting.
Our quarterly strategy review is built from the same data that runs your service: response times, security posture in four tiles, backup status, device age, and the roadmap and budget. Nothing is retyped. You can act in the meeting, and the plan on the slide matches the plan in your client portal.
Most quarterly reviews are built the same way. Someone exports a few reports, pastes the figures into a template, and writes a summary from memory. The deck looks fine. It is also a week old by the time the meeting starts, and nobody can trace a number back to its source.
We build the review from Resolved OS, the platform we run the service on. Here is what that changes, section by section.
It opens with the numbers
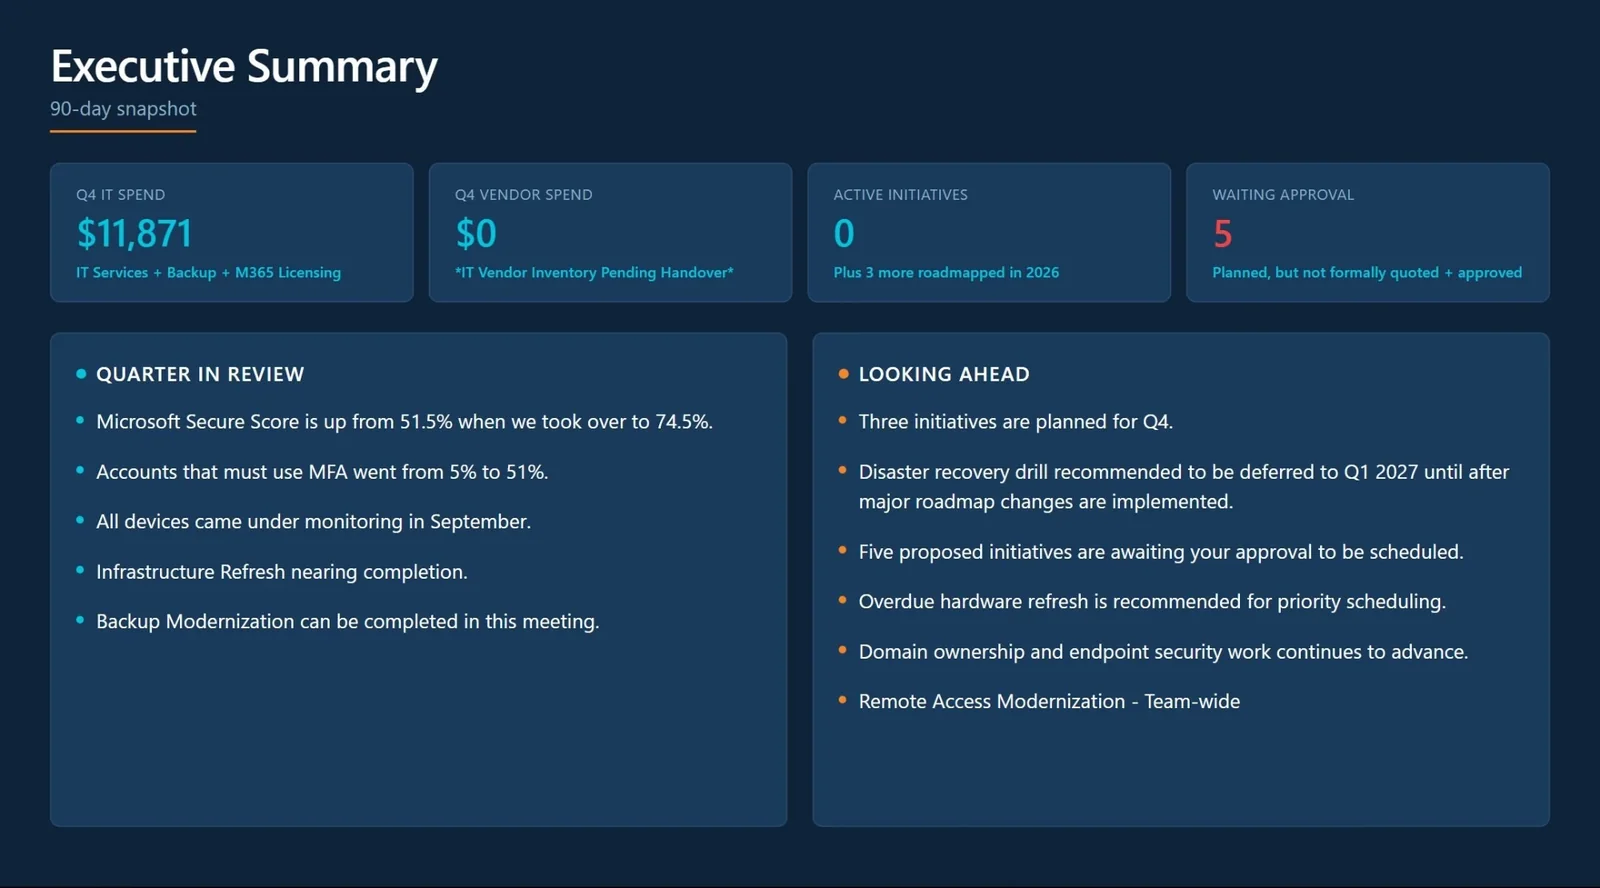
The first page shows the quarter in figures. Response and resolution times against the targets. Tickets handled. The share of work that was project work versus support.
Each figure comes with its trend since the last quarter. The numbers come from the service desk, not from memory, so the conversation starts with what happened and not with whether the figures are right.
Security posture in four tiles
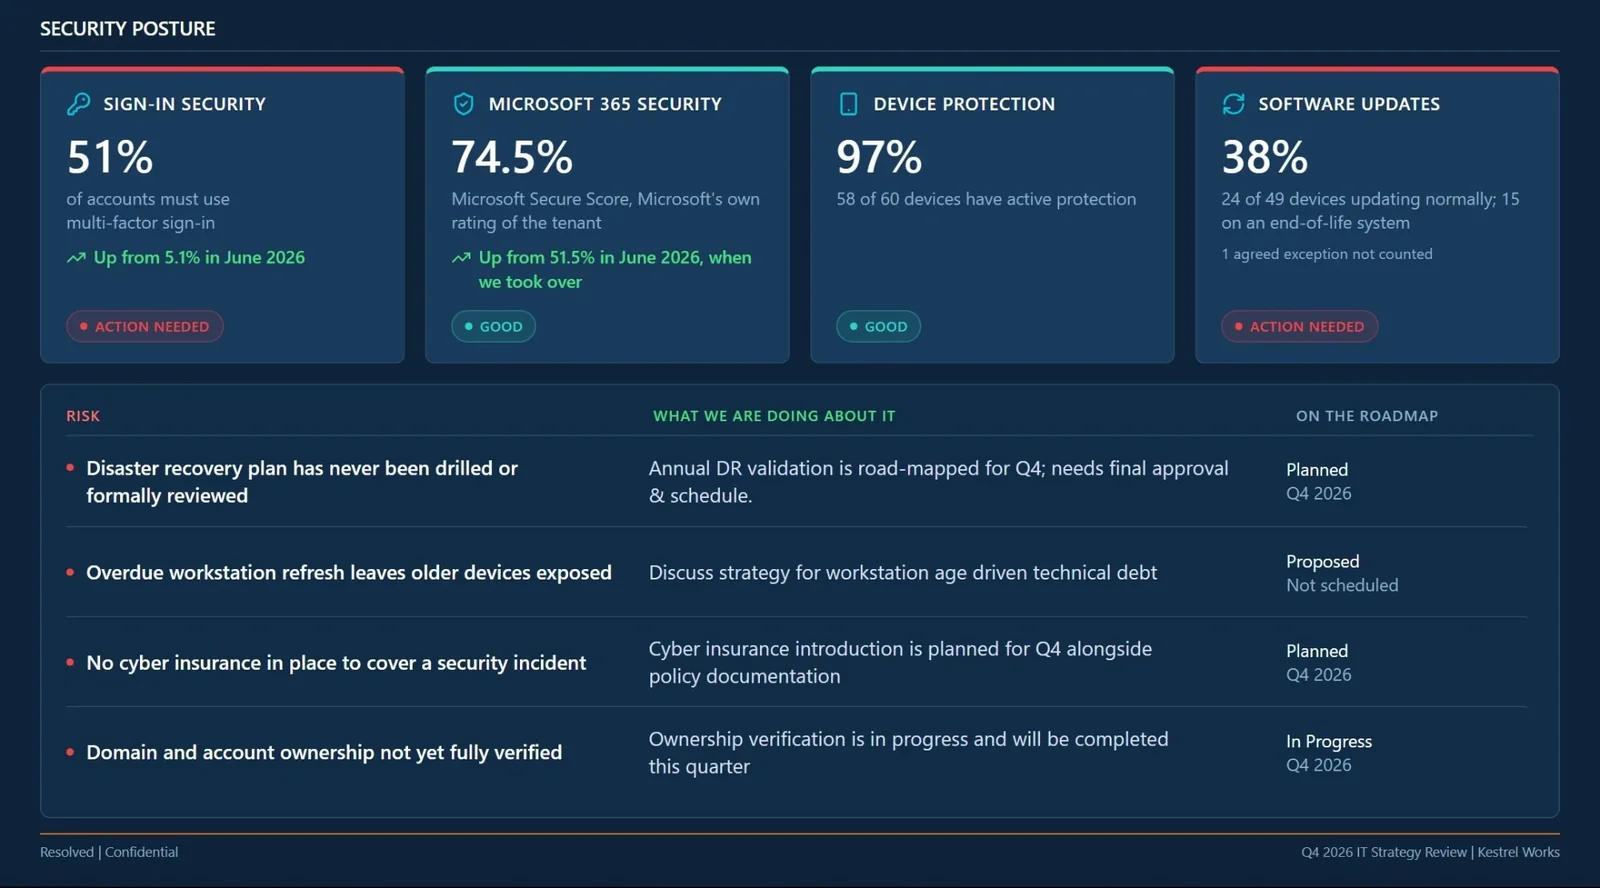
The second page shows four tiles: sign-in security, Microsoft 365 security, device protection, and software updates.
Each tile has a figure, a trend since we took over, and the agreed exceptions not counted. We explained why we count the exceptions in an earlier post. The short version: the number on the tile is the number your insurer can check.
Backup and recovery: what we do, and what you still owe
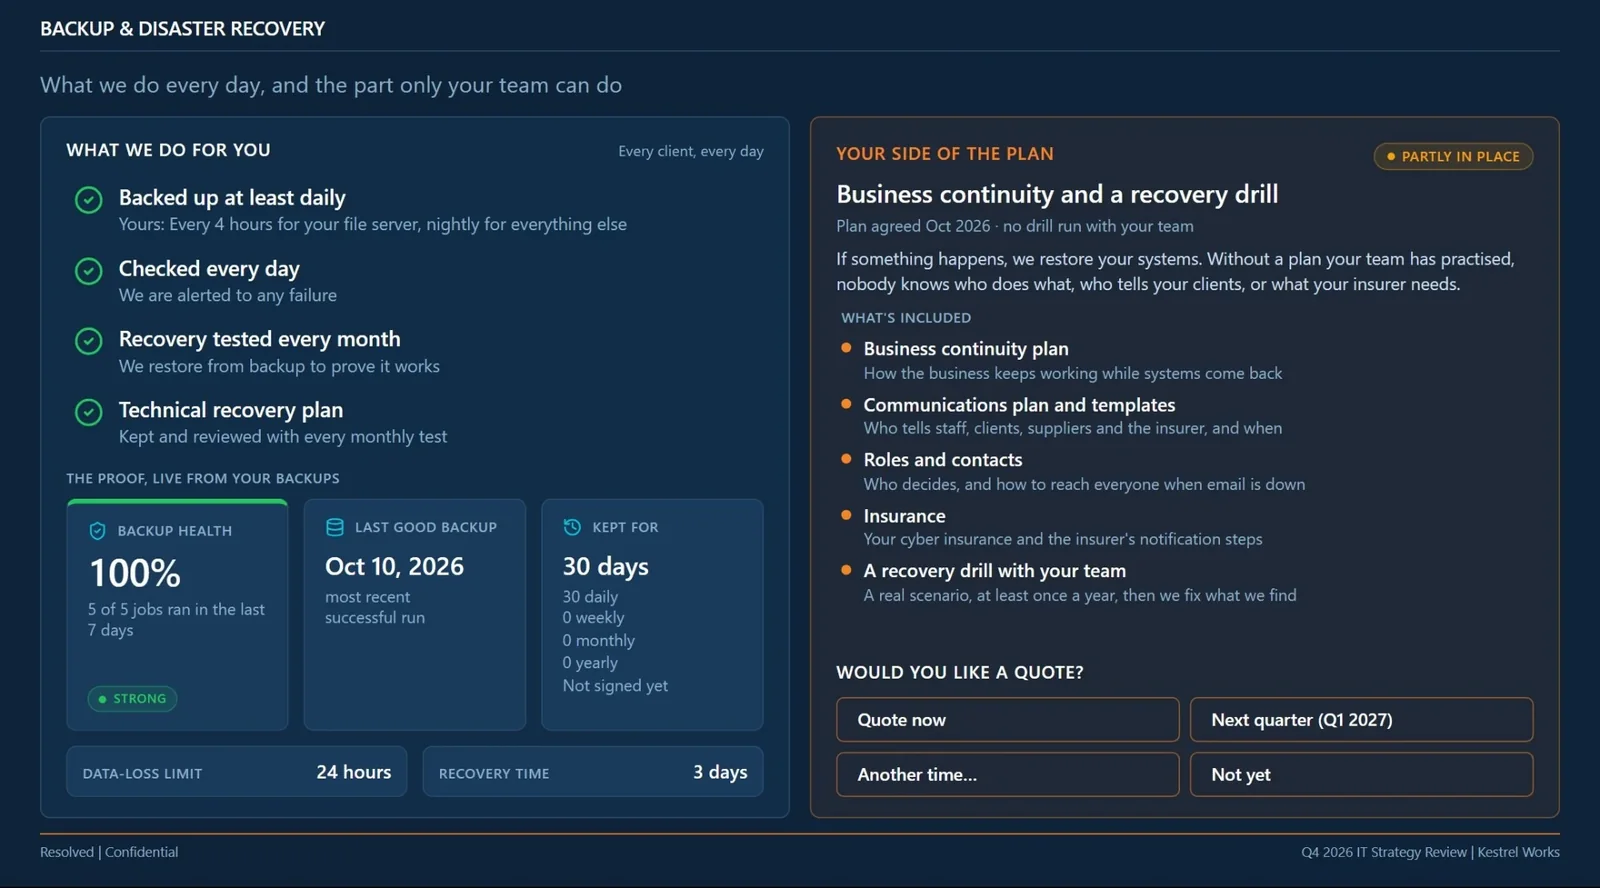
The backup page has two columns.
The first column is what we do every day. Backups run. Test restores happen every month. The technical recovery plan is current, with recovery time objectives you have seen.
The second column is what you still owe. A business continuity plan is how the firm keeps working while systems come back. A recovery drill with your own team proves the plan. We list both in every review until they are done, because a backup without a continuity plan recovers the data and not the business.
Devices and infrastructure
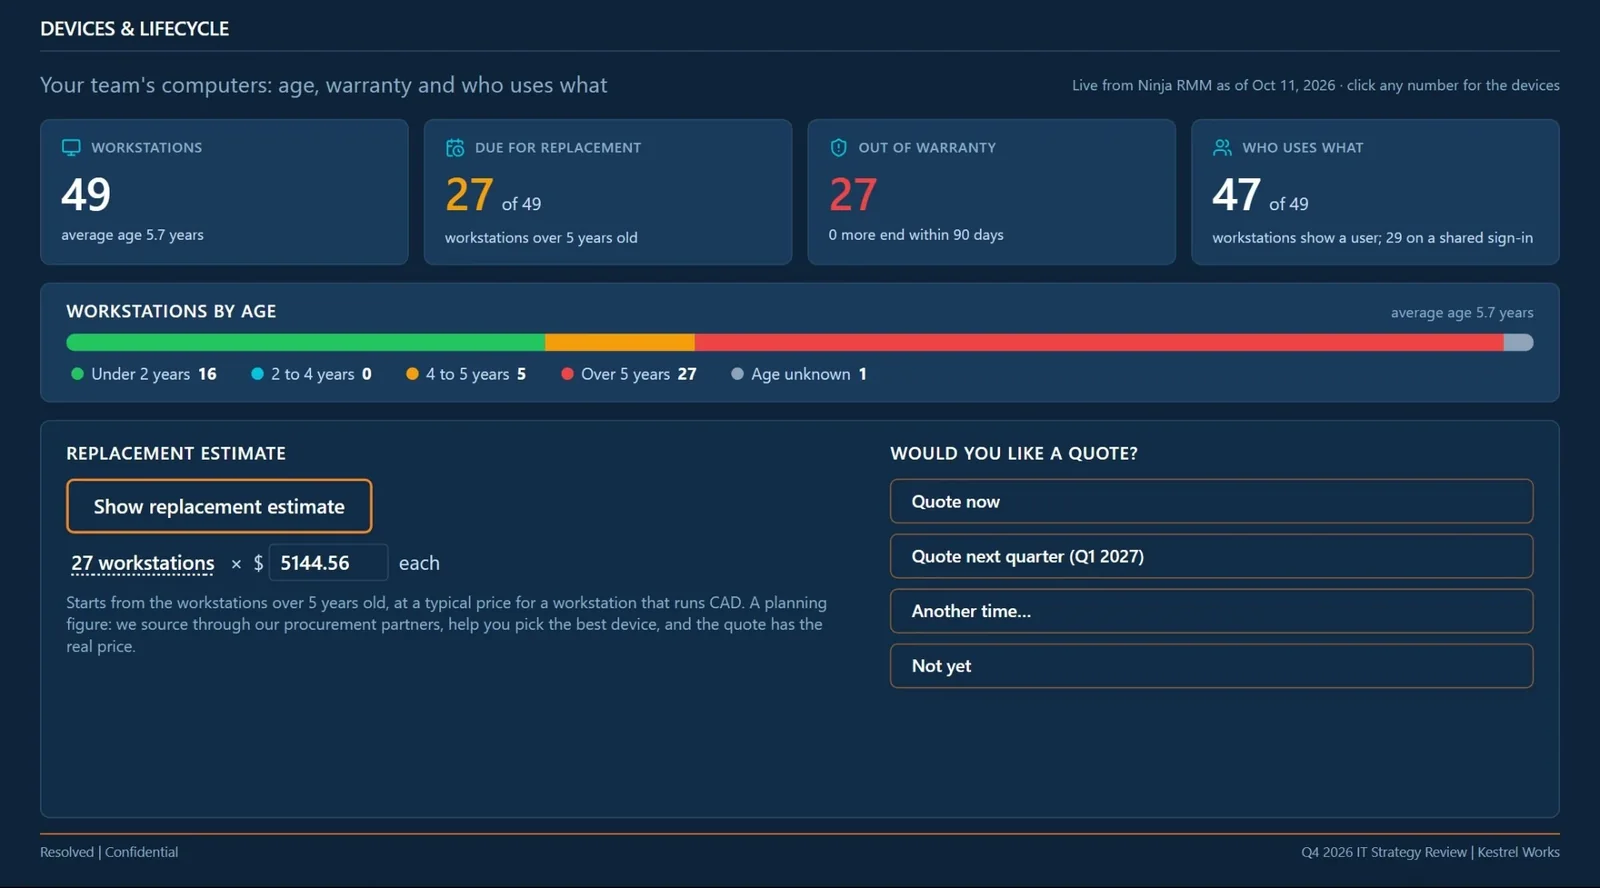
The device page shows the fleet by age and warranty, and what is being replaced this quarter. It is the working view of the refresh cycle.
You can retire a device in the meeting. The change lands in the asset list before the meeting ends. There is no follow-up email and no second list to reconcile.
The roadmap and budget update from the same data
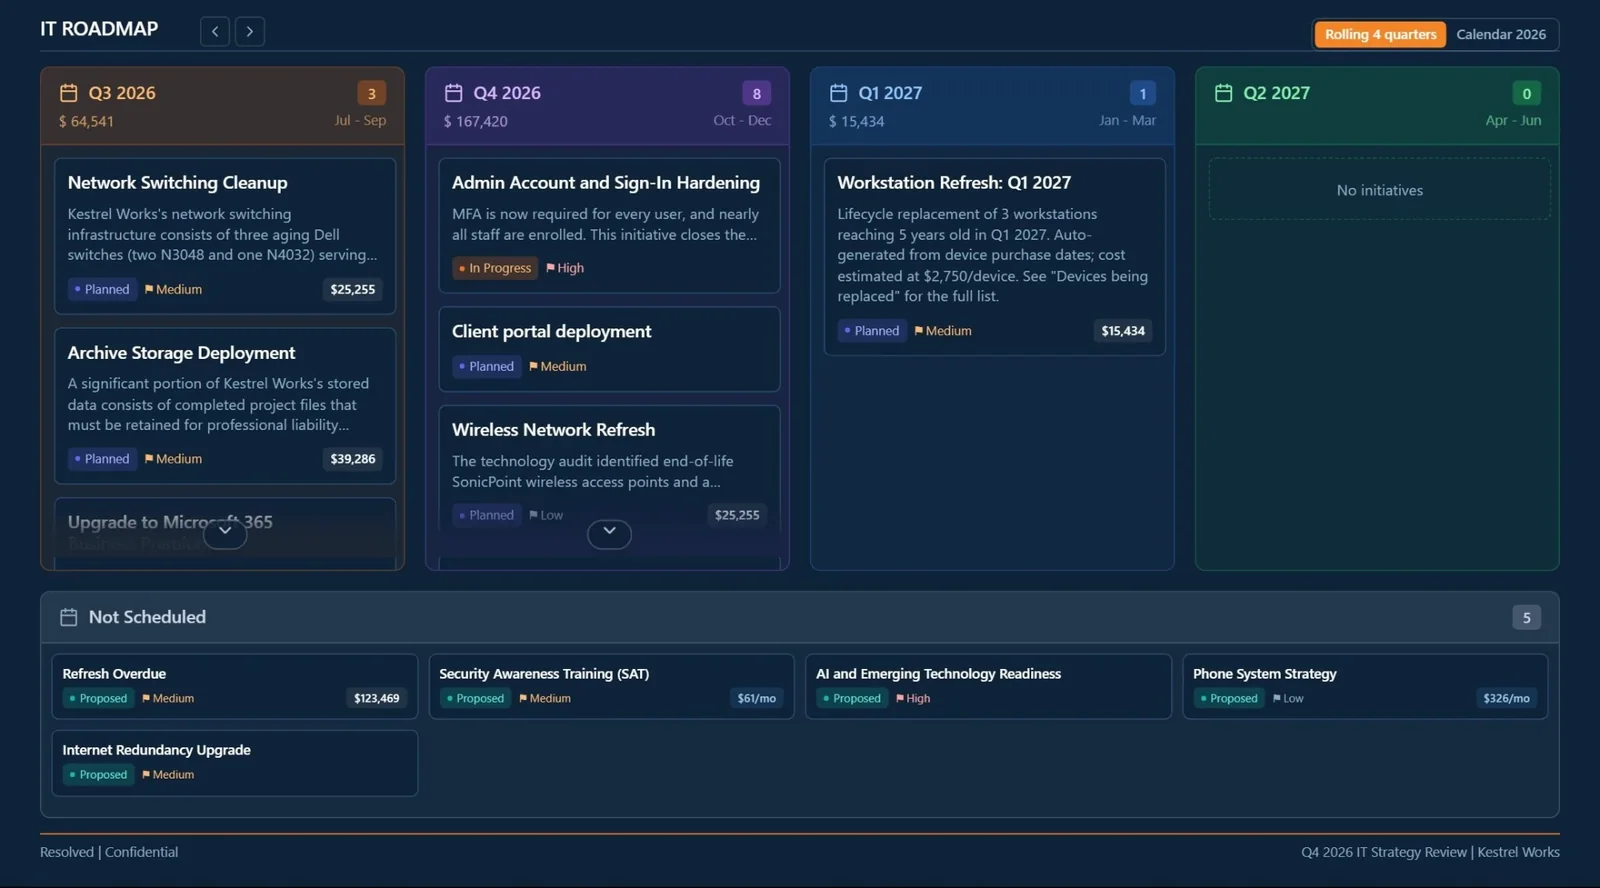
The last section is the roadmap and the budget. Both are built from the same records as the pages before them. A device retired on the device page leaves the budget. A risk accepted on the security page is recorded against the roadmap.
A decision made in the review, whether a retirement, a risk acceptance, or a retention period, is signed electronically and kept on your record. The plan on the slide matches the plan in the client portal, because they are the same plan.
If you want to see the format, the sample technology roadmap and sample technology budget are anonymized versions of a real client’s deliverables.
What this means for your firm
Ask to see your last quarterly review. Then ask where each number came from, and how old it was on the day of the meeting.
If the deck was built the night before, the review is a story about your technology. A review built from live data is a record of it, and a record is something you can plan on.
The quarterly strategy review is included in every Managed IT plan. If you want the first one, a Strategic Technology Assessment produces the baseline it is measured against.
News & Insights
All insights